Motion and Time Class 7 Science
Motion and Time Class 7 Science
CBSE Class 7 Science Notes Chapter 13 Motion and Time
In our daily life routine, we usually see some objects at rest and others in motion like birds fly, fish swimming, planets moving around the sun, etc., are all in motion. When an object changes its position with time, we often perceive an object to be in motion, e.g. when the position of a car changes with time, we say that the car is moving or the car is in motion.
Types of Motion
The motion of all the objects are not of the same type. There are four different types of motion shown by the different objects.
Rectilinear motion: The motion possessed by the body moving along a straight line path, is called rectilinear motion,
e.g. the motion of a train on a straight bridge.
Circular motion: The motion possessed by a body when it moves along a circular path, is called circular motion,
e.g. the motion of a child in a merry-go-round, motion of the earth around the sun in a circular orbit.
Rotational motion: The motion possessed by a body when it spins about a fixed axis, is called rotational motion,
e.g. the motion of the earth about its axis, spinning top, the motion of blades of a fan.
Periodic motion: The motion which repeats itself after regular intervals of time, is called periodic motion,
e.g. the motion of the swing, to and fro motion of a simple pendulum.
Slow or Fast Motion
An object which takes a long time to cover a certain distance is known as slow while the other object which takes shorter time to cover the same distance is known as fast, e.g. if your school is at a distance of 5 km from your home and you want to go to school by bicycle, then it may take about 25 min to reach the school and if you go to school by school bus, then the same distance can be covered only in 10 min.
It means that a bicycle takes a longer time than the bus.
Thus, the most convenient way to determine which of the two objects is moving faster is to compare the distance moved by them in a unit time which is known as speed.
Speed
The distance travelled by an object per unit time (either in one hour, in one minute or in one second) is known as speed of the object. A slow moving object is said to have a low speed and a fast moving object is said to have high speed. So, if we know the distance covered by two buses in one hour, then we can answer which one is slower. Therefore, the formula for calculating the speed of an object can be given by
Speed = Distance travelled/Time taken
e.g. If a car travels a distance of 100 km in 2 h, then the speed of this car is given by
Speed = 100km/2h = 50 km/h
It shows that the car will travel a distance of 50 km in 1 h. It does not matter if a car seldom moves with a constant speed for one hour as it starts moving slowly and then picks up speed. So, when we say that the car is moving with a speed of 50 km/h, then we do not bother whether the car has been moving with a constant speed or not during that hour. Therefore, the speed calculated here is the average speed of the car.
Non-Uniform and Uniform Motions
In everyday life, we seldom find objects moving with a constant speed over long distances or for iong durations of time. If the speed of an object moving along a straight line beeps changing, its motion is said to be non-uniform motion.
On the other hand, an object moving along a straight line with a constant speed is said to be in uniform motion. In this case, the average speed is the same as the actual speed.
Units of Speed
The unit of speed depends upon the unit of distance and the unit of time used.
- The metre is the standard unit of distance and second is the standard unit of time. So, the standard unit of speed is metre per second (m/s).
- The large values of speed are expressed in kilometre per hour (km/h) and in this case, the distance travelled is measured in terms of kilometre and time taken is measured in an hour.
- The small values of speed are expressed in centimetre per second (cm/s) and in this case, the distance travelled is measured in terms of centimetre and time taken is measured in second.
If we have to compare the speeds of a number of objects, then we must express the speeds of all those objects in the same unit.
Measurement of Time
A duration or moment in which things occur is known as time. With the help of clocks and watches, we generally
measure time. It is very difficult to think that how did the people in ancient time measure times as they did not have clocks or watches.
In order to measure the time, ancient people used some natural events which repeated regularly after fix time intervals, e.g. they found that the sun rises every day in the morning. So, the time between one sunrise and the next I was known as a day. In a similar manner, time from one full moon to the next full moon was. called a month.
A year was fixed as the time taken by the earth to complete one revolution of the sun.
Many time measuring devices were used in different parts of the world before the pendulum clocks became popular. Sundials water clocks and sand clocks are some examples of such devices.
Note
(i) A sundial measures time by the position of the shadow cast by the sun.
(ii) The device which uses the flow of sand from one glass bulb to another in order to measure time is known as a sand clock
(iii) A device which uses the rate at which water drip from one vessel to another measure time interval is known as a water clock
Simple Pendulum
A simple pendulum consists of a small metal ball called bob which is suspended by a long thread from rigid support such that bob is free to swing back and forth. The to and fro motion of a simple pendulum is an example of periodic or oscillatory motion. Galileo was the first person to study the motion of a pendulum.

A pendulum completes every swing or every oscillation in exactly the same time provided its length should be kept constant. The pendulum is said to have completed one oscillation when its bob starting from its mean position F, moves to D, to E and back to F. The pendulum also completes one oscillation when its bob moves from one extreme position D to the other extreme position E and come back to D. So, the time taken by the pendulum to complete one oscillation is called its time period. The time period of a pendulum depends on its length. The length of a pendulum is the length of thread from the point of suspension to the centre of the bob.
Note: Galileo experimented with various pendulums to verify his observation. He found that a pendulum of a given length tabes always the same time to complete one oscillation. This observation led to the development of pendulum clocks. Winding clocks and wristwatches were refinements of the pendulum clocks.
Units of Time
Second is the basic unit (or standard unit) of measuring time and it is represented by symbol s. The larger units of time are minute and hour.
i.e. 1 h = 60 min and 1 min = 60 s
Different units of time are used depending on the need, e.g. in order to express the longer time interval, the bigger units of time are used, i.e. day, month and year.
i.e. 1 day = 24 h, 1 month = 30 days and 1 year = 12 months
Note: Nowadays, most clocks or watches have an electric circuit with one or more cells. These clocks are called quartz clocks. The time measured by quartz clocks is much more accurate than that by the clocks available earlier.
Measuring Speed
We have learnt how to measure distance and time, we can calculate the speed of an object. Now, we should learn how to measure the speed by doing an activity.
Speedometer and Odometer
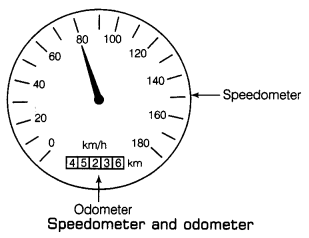
The speedometer is an instrument on a vehicle’s dashboard which indicates the speed of the vehicle when it is moving. This instrument tells us the speed of a running vehicle at that instant of time in kilometre per hour.
e.g. A panel of instruments fitted on the top of a scooter or a motorcycle. In the same way, metres can be seen on the dashboard of cars, buses and other vehicles in addition to the speedometer, there is another instrument in a vehicle called odometer. An instrument which is used for measuring the distance travelled by a vehicle is known as an odometer. This instrument measures the distance in kilometres. Usually, a small rectangular window within speedometer dial with the symbol km (as shown in the figure) gives the (metre) odometer reading.

Graphical Representation of Motion
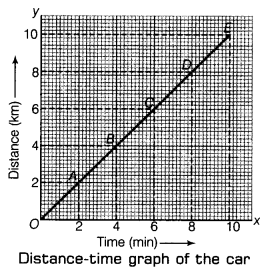
By drawing the distance-time graph, the motion of an object can be represented in diagram form. A distance-time graph represents how the distance travelled by a moving object changes with time.
Method to Draw Distance-time Graph
To draw a distance-time graph, use a graph paper. For drawing the distance-time graph for a moving object, we require the readings of distances travelled by the object and the corresponding time values which have been obtained experimentally.
The distances travelled by car at various times are shown below:
| Distance(km) | 0 | 2 | 4 | 6 | 8 | 10 |
| Time (min) | 0 | 2 | 4 | 6 | 8 | 10 |
- Firstly, we take the graph paper and draw a horizontal line OX (x-axis) and a vertical line OY (y-axis) at right angles to each other.
- Now, write time (min) on x-axis and distance (km) on the y-axis and also put arrows with them.
- In this problem, we have only small time values (0, 2, 4, 6, 8 and 10 min) to represent. So, the scale to be used for showing time can be 2 min = 2 cm. Here, we mark the time values 0, 2, 4, 6, 8 and 10 on the line OX as shown in the figure given as alongside.
- Again, the distance values given in this problem are small (0, 2, 4, 6, 8 and 10 km). So, the scale to be used for representing distance values on the graph can be 2 km = 2 cm. We now mark the distance values 0, 2, 4, 6, 8 and 10 on the line OY (see figure).
- We can see in the graph that the first reading given in this problem is time = 0 and distance = 0. The point O (called origin) represents the 0 (zero) values both for time and distance. Therefore, at point O on graph paper, time is 0 and distance is also 0. The second reading is time = 2 min and distance = 2 km.
- Now, the vertical line above the 2 min mark on the graph paper and horizontal line on the right side of 2 km mark on graph paper cross at point A (see figure). So, we put a pencil dot at point A.
- In the same way, the third, fourth, fifth and sixth readings of time and the corresponding readings of distance will give us points B, C, D and E on the graph paper which are marked as pencil dots (see figure).
- After joining the point O and the dots at point A, B, C, D and E with a pencil line, we will get a straight line graph OE (see figure). So, this is the required distance-time graph for the motion of the car.
Since the distance-time graph for the motion of the car is a straight line, so from here we can conclude that the car is moving with a constant speed (or uniform speed).

Other Types of Graph
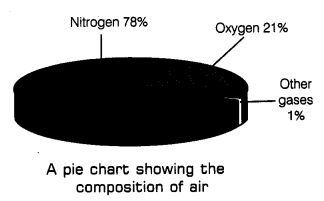
We generally see while reading newspapers, magazine, etc., that the present information is represented in various forms of graphs in order to make it interesting. These graphs generally bar graphs and pie chart as shown in the figure.
A diagram which shows information as thin rectangles (known as bars) of different heights is known as a bar graph. In this graph, the position and heights of the bars represent the values of the variable quantity about which information is being given.

A kind of graph or diagram which shows the percentage composition of something in the form of slices of a circle (the whole circle representing 100 per cent), is known as a pie chart.
